amiMeasure
The amiMeasure system combines data from various sources (e.g. data from measuring devices, provided by another application, internal service or external portals). It presents them in one application, in a clear and efficient way.
Thanks to this, important data is in one place, and efficient access to real results provides support in making many business decisions, including utilities consumption, future investments or cost optimization of production processes.

How does it work?
The amiMeasure system consists of:
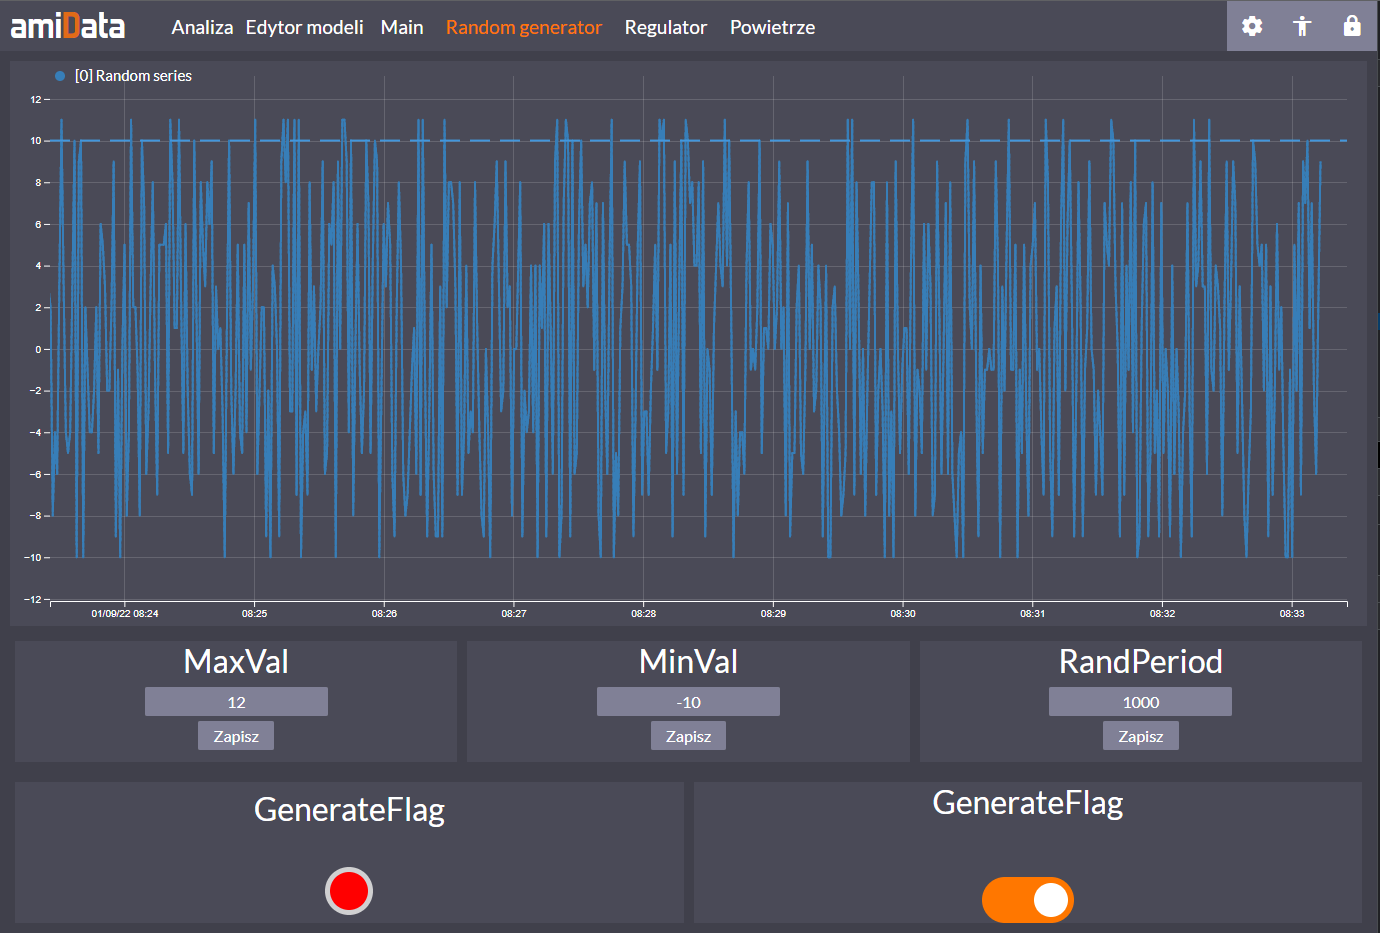
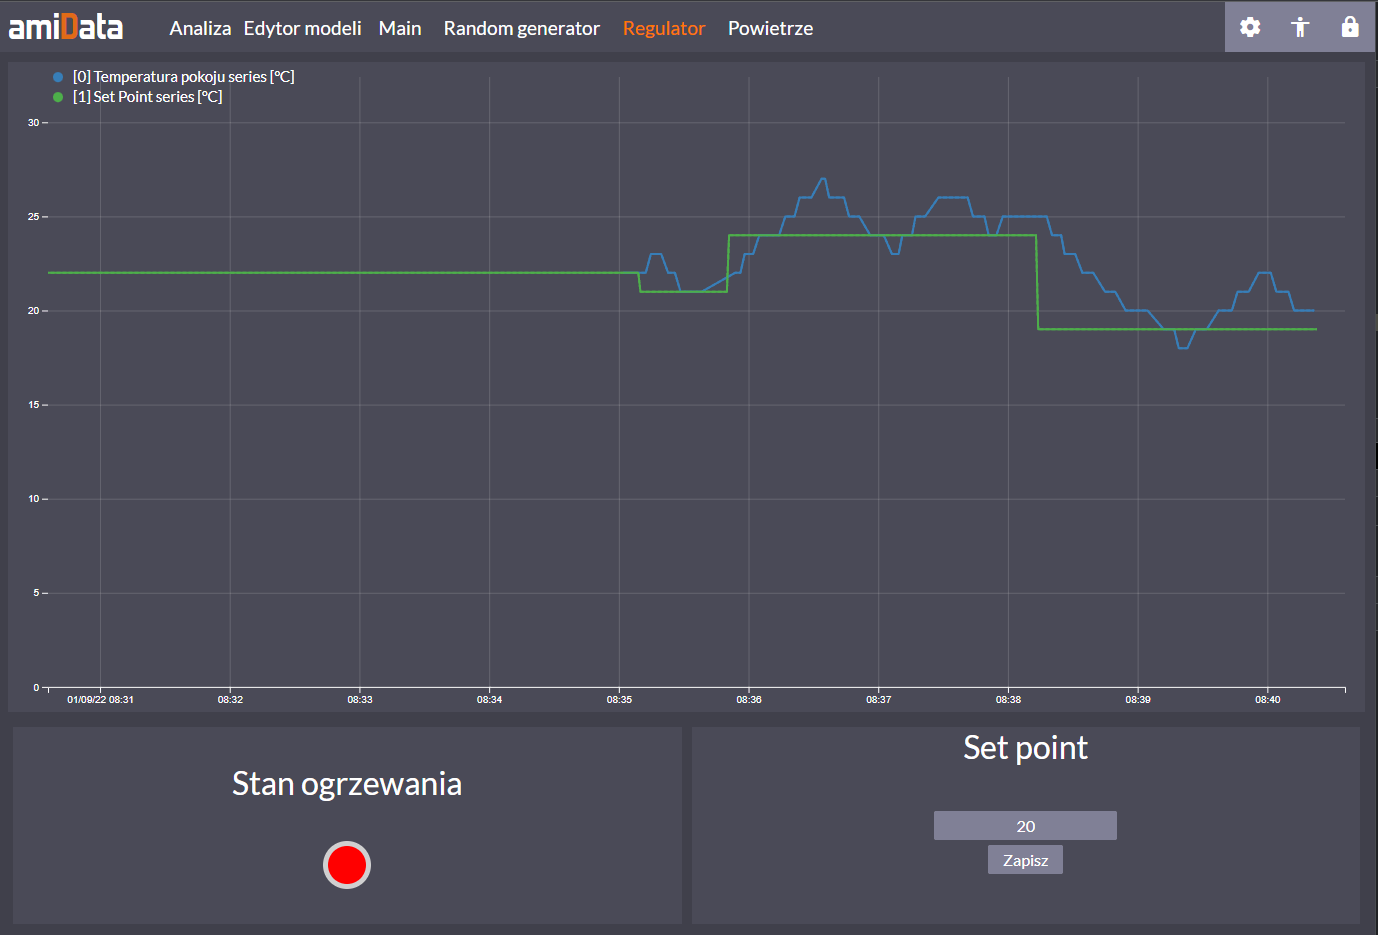
- consumer application – allows you to visualize data from the following various: machines, devices, services. It also gives you the ability to add widgets to the control (e.g. switch, entering the set value). The data is visualized in a legible way – in the form of charts, progress bars, content. The consumer application is intuitive to use and does not require specialist knowledge in everyday use.
- Integration and development part – responsible for editing scenes and creating logic paths for the entire solution.
The system is flexible and allows you to adjust it to the individual needs and requirements of a specific activity. There are a lot of possibilities to use the system and achieve measurable benefits from your data!
Goals and benefits of using the amiMeasure system
 Quick access to real data.
 Easy data analysis.
 Support in making effective business decisions.
 Cost optimization based on the obtained data.
amiMeasure system functions
Archiving – When making business decisions, you need not only current data, but also indicators from previous days, months or years. Thanks to the amiMeasure system, you will easily gain knowledge about historical data.
Acquisition – Checking indicators from many machines, devices or applications is extremely difficult and time-consuming. The amiMeasure solution allows for constant access to up-to-date data. It collects information such as from measuring devices, applications or external services.
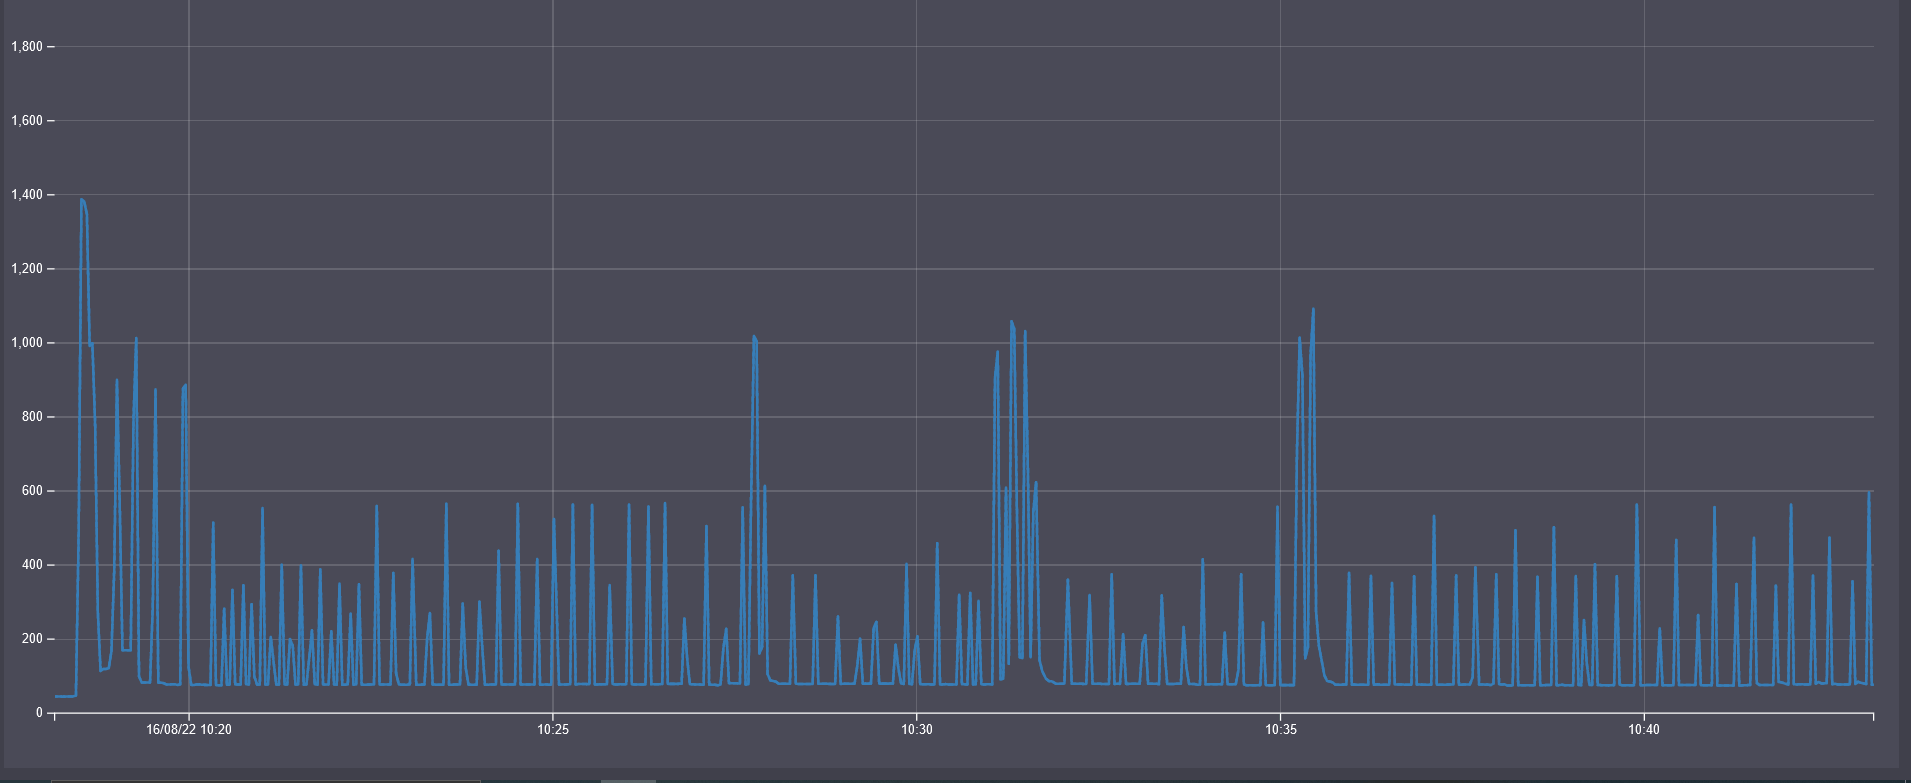
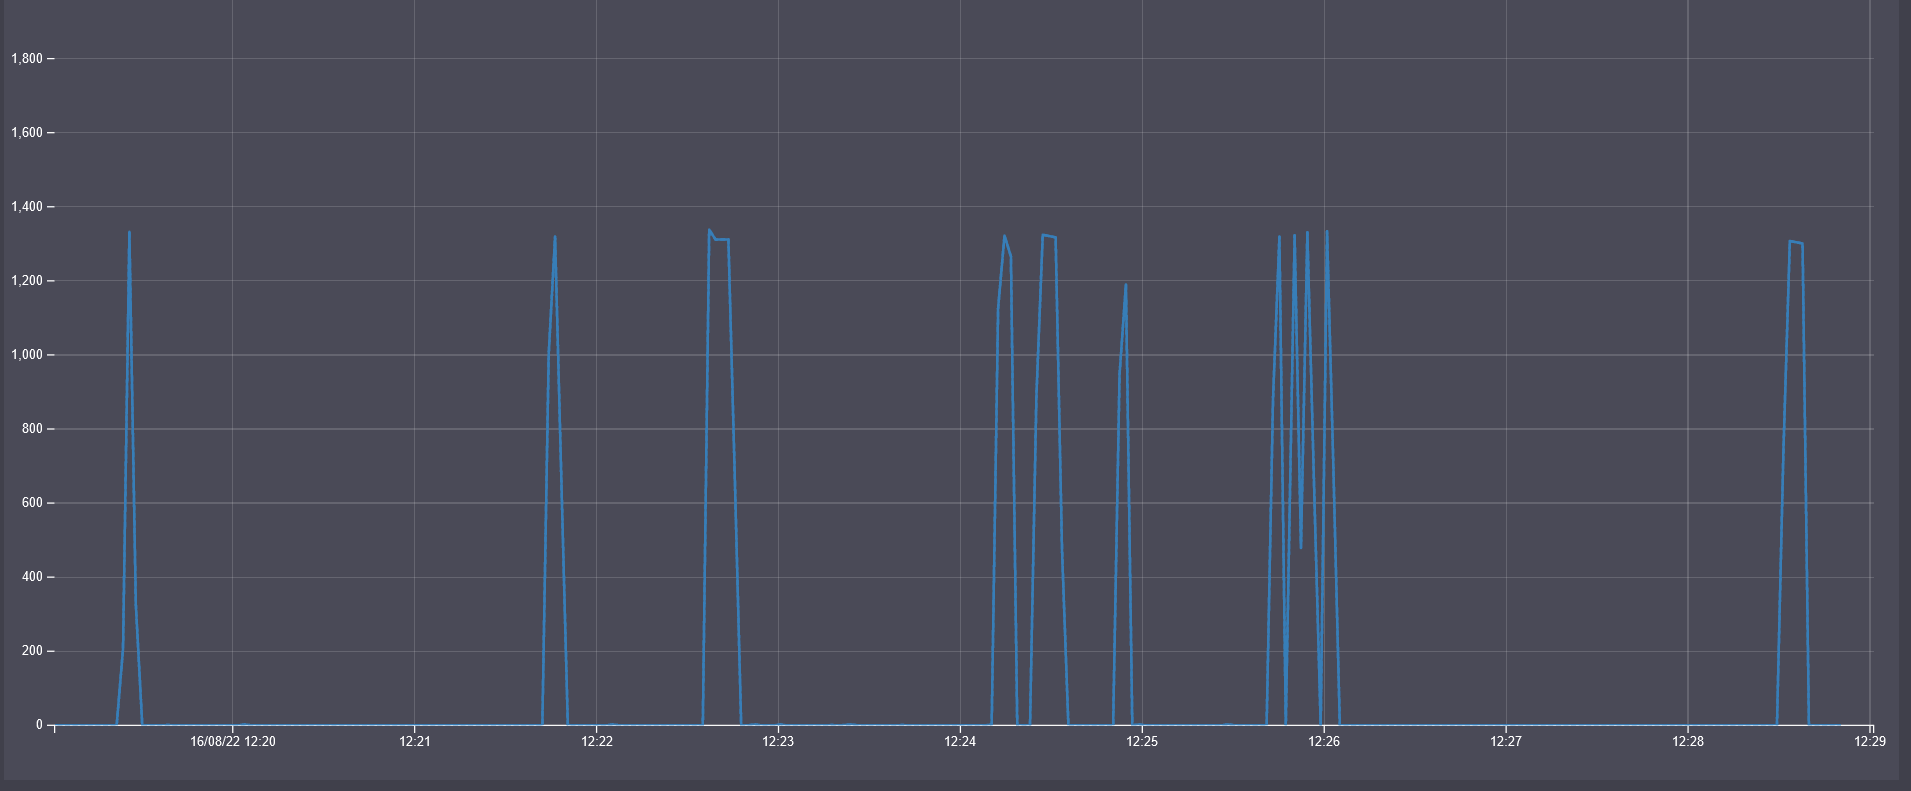
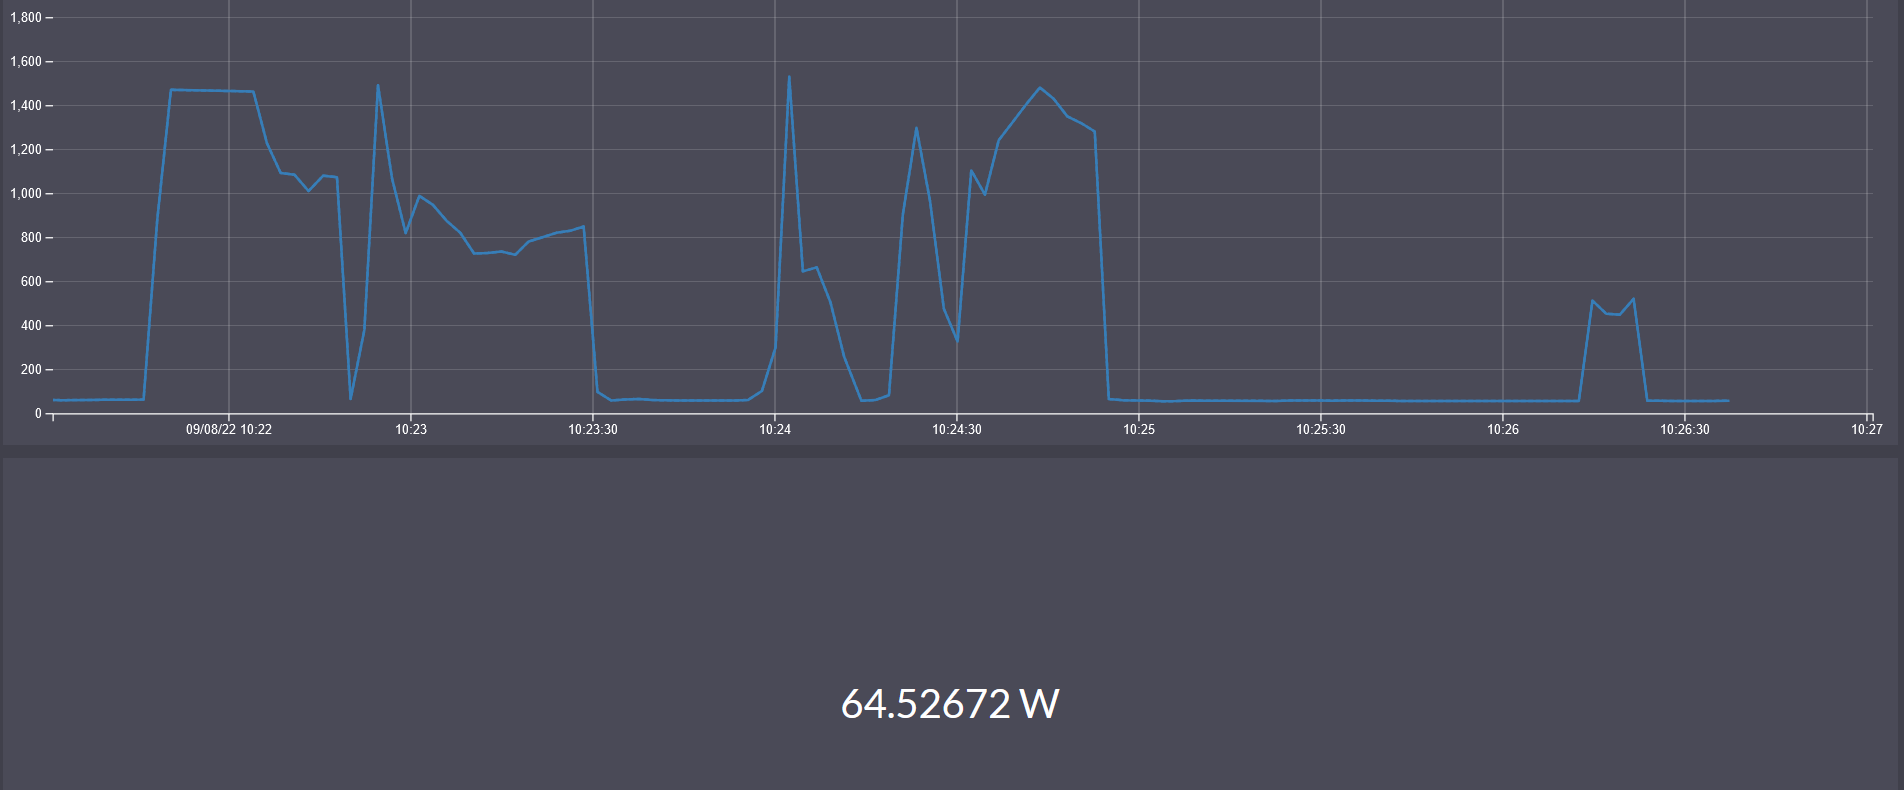
Visualization – Just one look is enough and you know the data. The tool enables visualization of data in the form of text, charts, progress bars, widgets. It is flexible and allows you to adjust it to the individual needs of the company. Everyday use of the amiMeasure system is intuitive – it does not require specialist technical knowledge.
Alerting – How to make sure that the air conditioning does not remain active after office hours? How can you be sure that the temperature in a given room will not exceed the set level? The answer is quick access to information – get it with the alerts. After exceeding certain indicators, the amiMeasure system sends automatic messages (alerts), e.g. by e-mail. Thanks to this, if a certain indicator is exceeded, you will immediately receive information.

amiMeasure development
The system is constantly being developed with new functions and possibilities. Its flexibility and scalability mean that it will bring many benefits to both large production plants and by providing data that will allow cost optimization, e.g. electricity consumption.