How does it work?
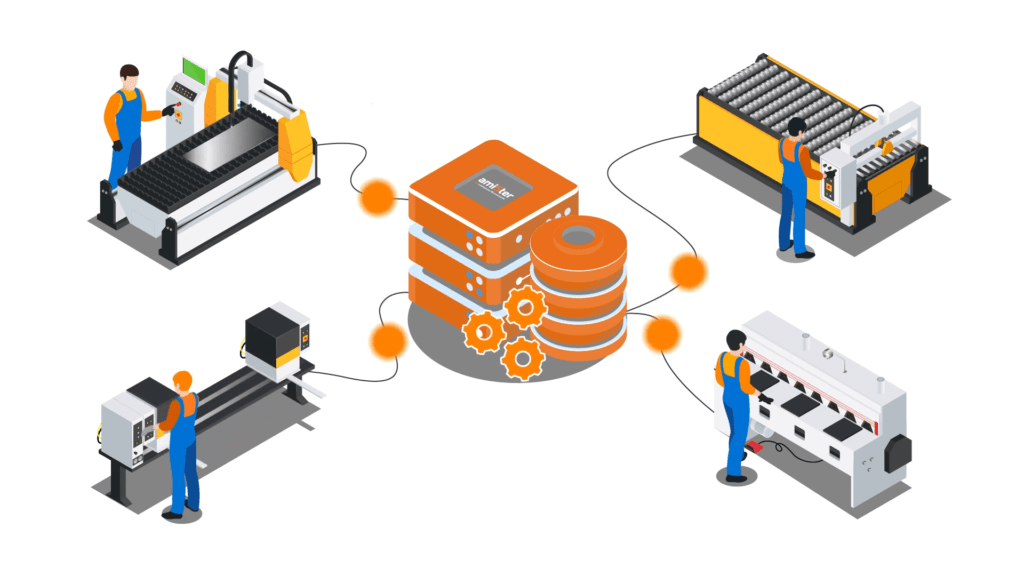
The heart of the system is an industrial database in which data distributed throughout the plant is concentrated and archived. The concentration of data is carried out on three layers of specialization.
At the electrical level, we collect data from the electrical (signal) installation, at the automation level, we read the data from PLC controllers, and in the IT layer we implement synchronization adapted to the data source technology.
The purpose of the implementation is the aggregation of data into a homogeneous form that enables their analysis and systemic support for the inference process.
Using reports, alerts and visualizations, the software supports users in making key decisions.
Goals and benefits of using the system to collect and analyze production data
 Access to historical data from machines.
 Easy data analysis.
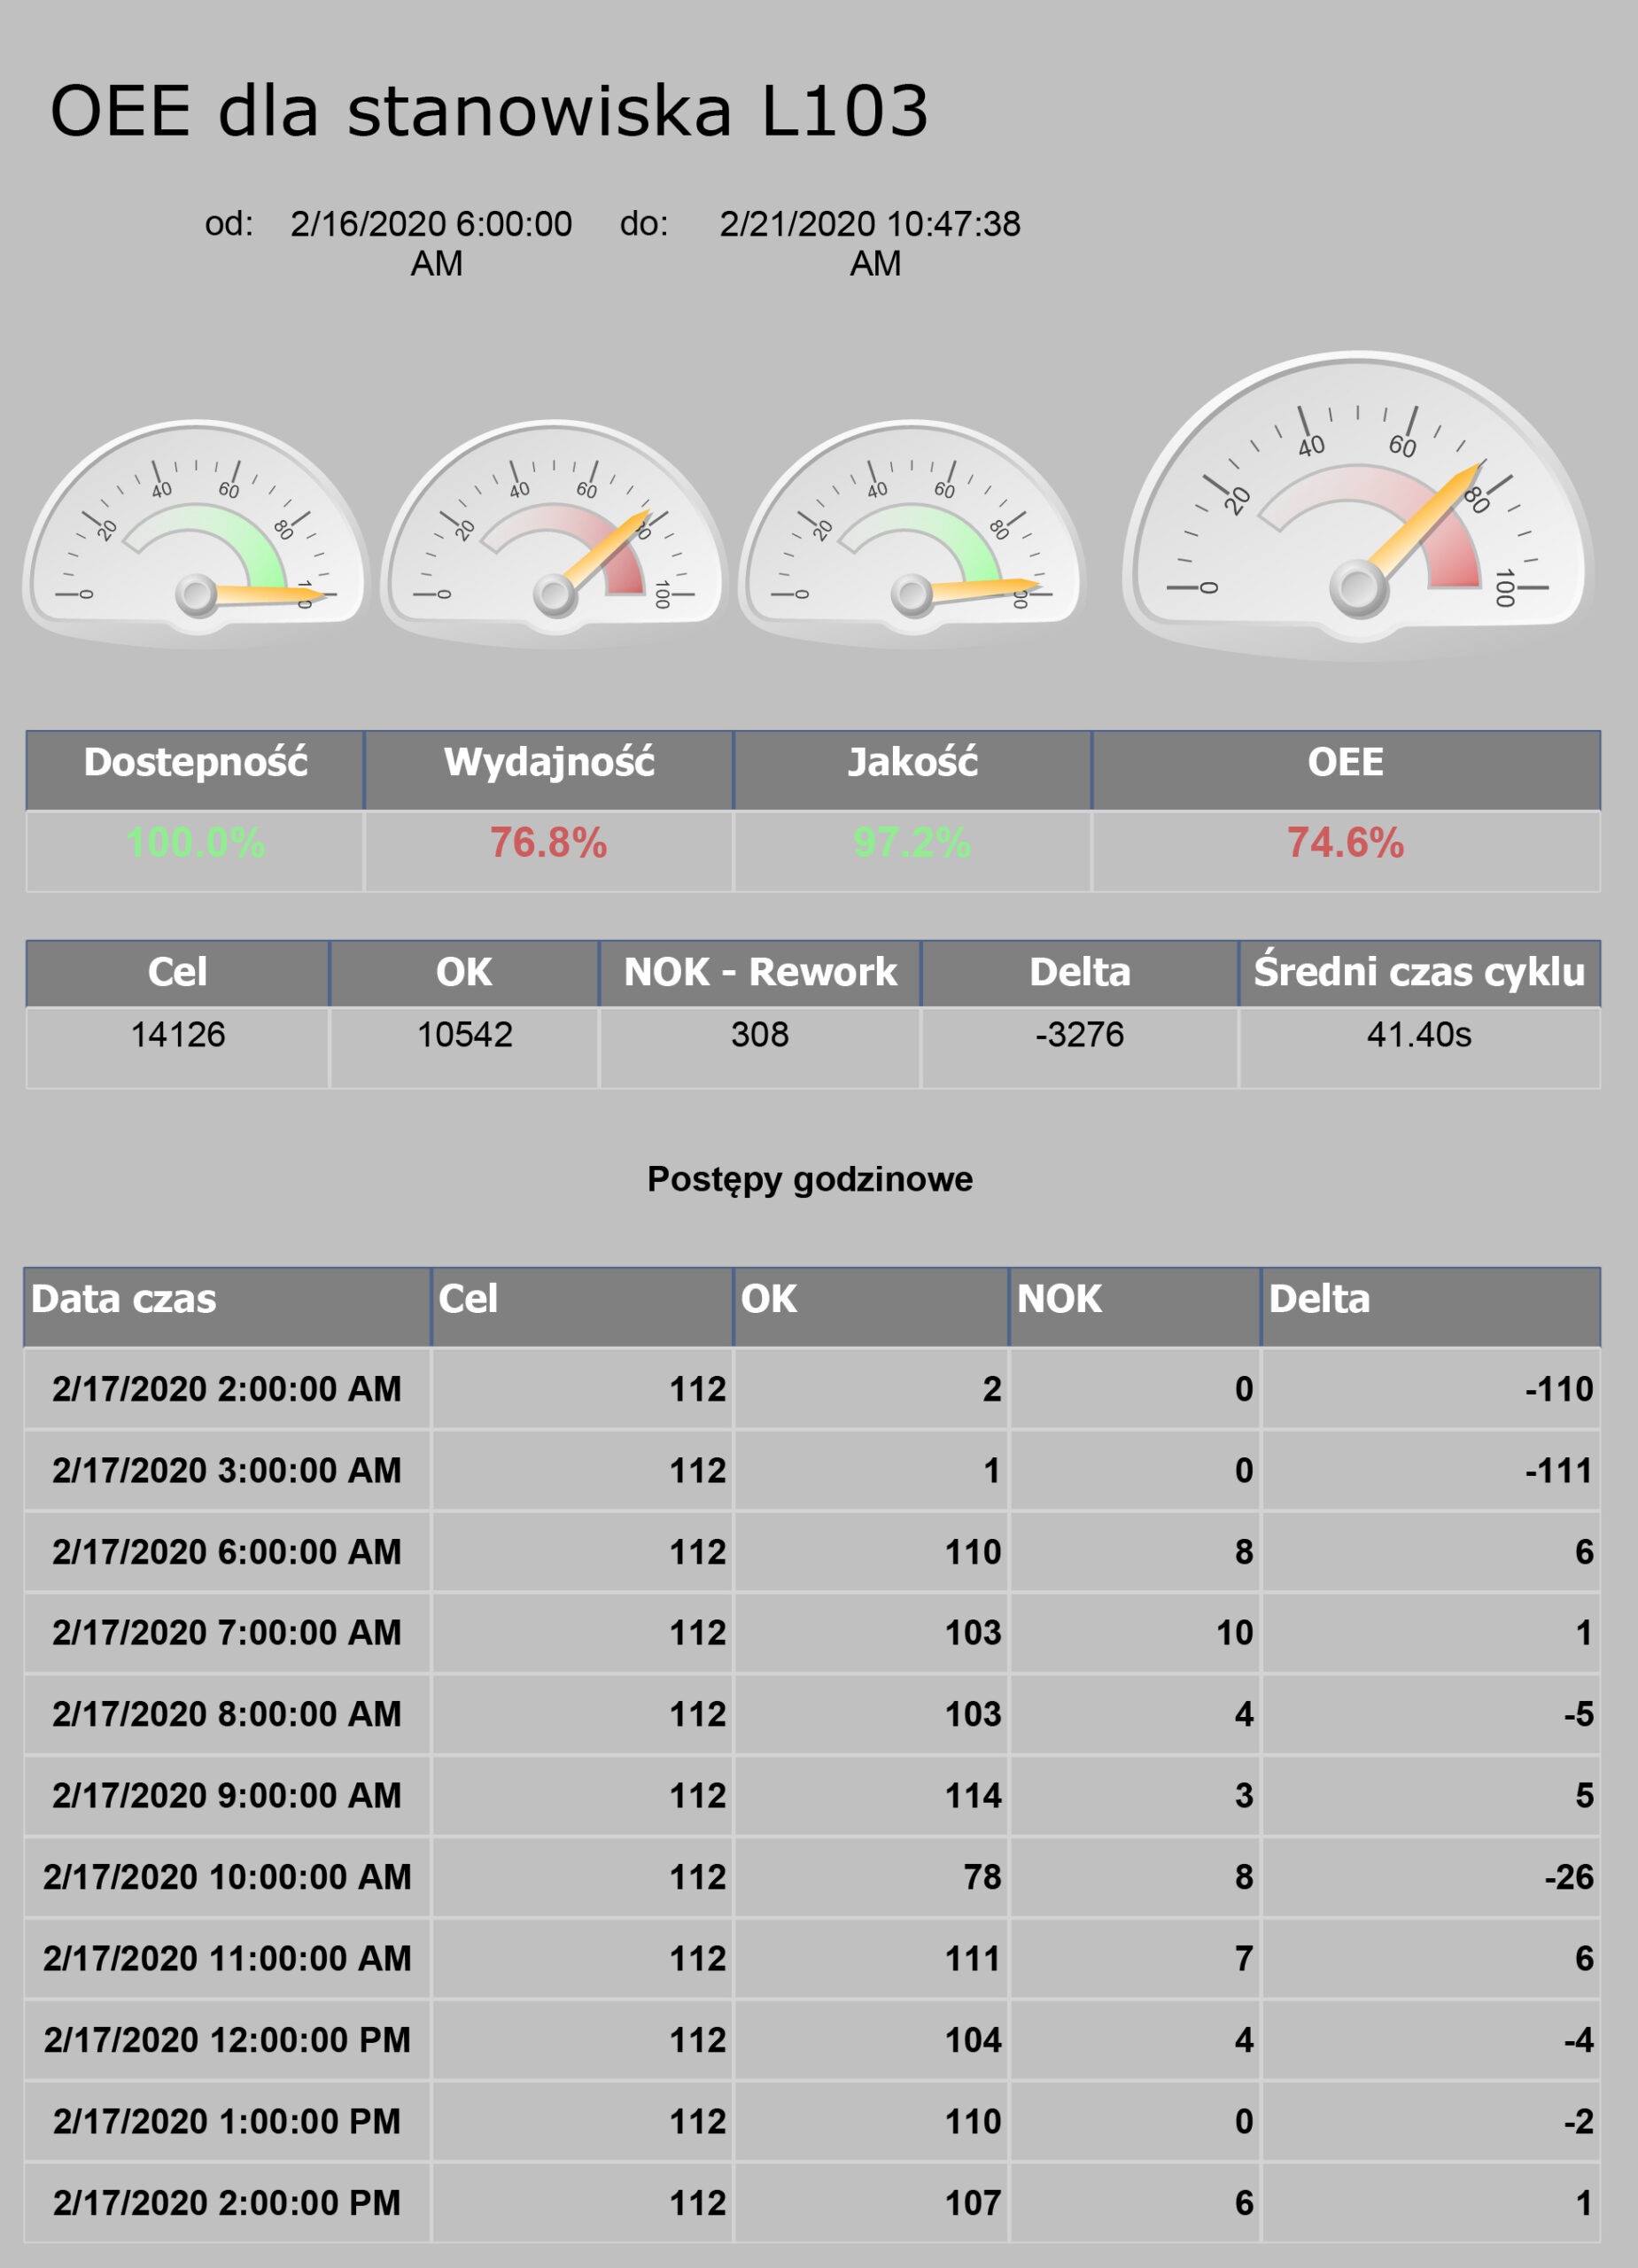
Overall Machine Performance Report
The report allows you to verify the productivity of a machine or a selected area. It helps locate frequent downtime. It presents all OEE indicators in one place. In addition, it facilitates the location and verification of problems in the production process and allows you to assess whether production is efficient. Many people have access to the reported data at the same time.

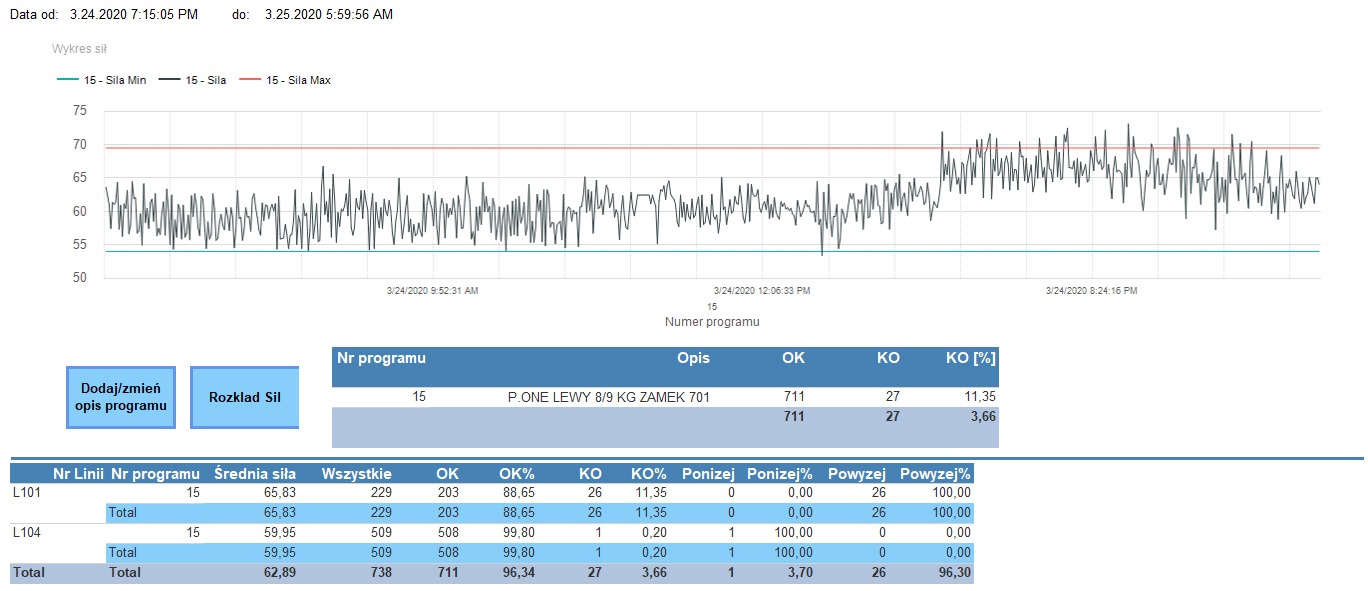
Labor force report with the product
This report shows the values that are measured for the selected program. We have the option of creating three types of reports: a numerical and percentage summary for good and bad measurements, a general report, a summary divided into assembly lines. The first report shows all the measurements made, and thus helps to determine in which range of values there were the largest number of measurements. The second report shows an unfavourable ratio of good to bad items. The problem is the measured values – they are too high.
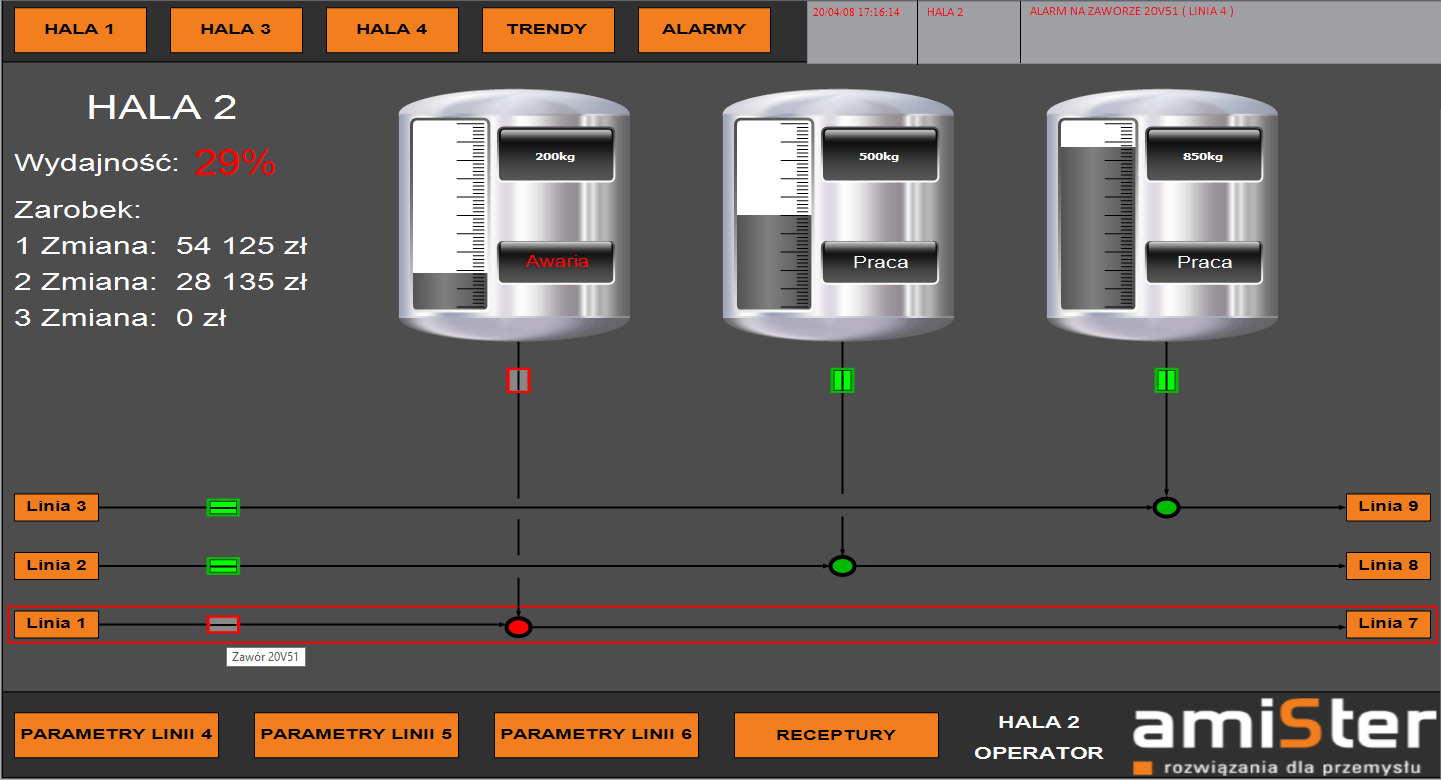
Visualization of a damaged element
Thanks to the appropriate visualization, the operator is able to detect the problem and take appropriate steps to solve it. Unfortunately, frequent stopping one element of the installation stops the entire area. Visualization comes in handy here. It indicates exactly which facility has switched off the entire area out of production.
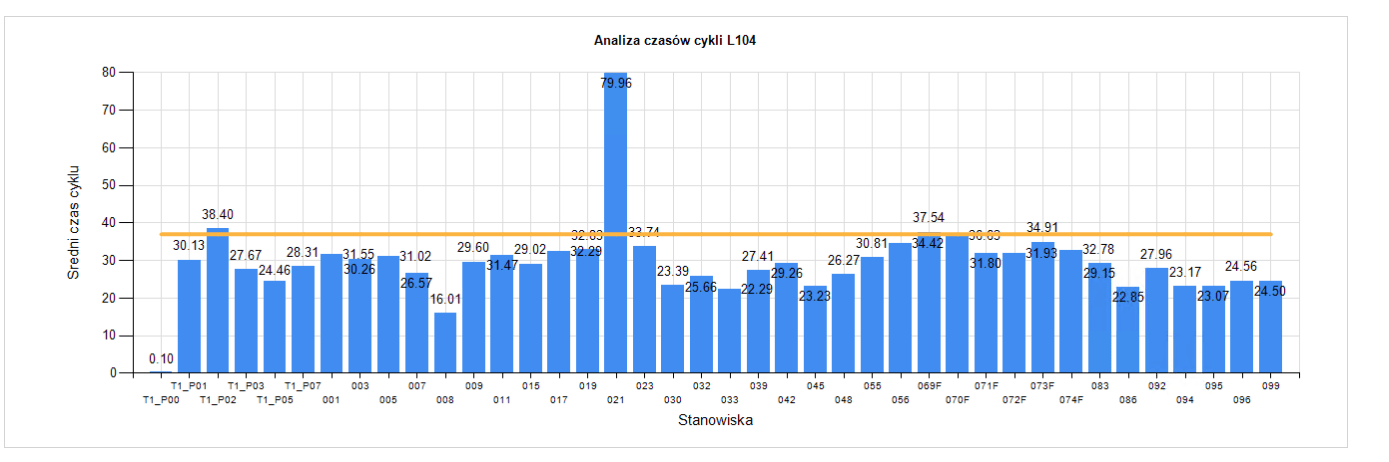
Average cycle time report
The data is processed in such a way as to improve production monitoring, which allows for the elimination of problems. This report provides the necessary knowledge to improve the production process. It also allows for the analysis of intended and achieved production goals.

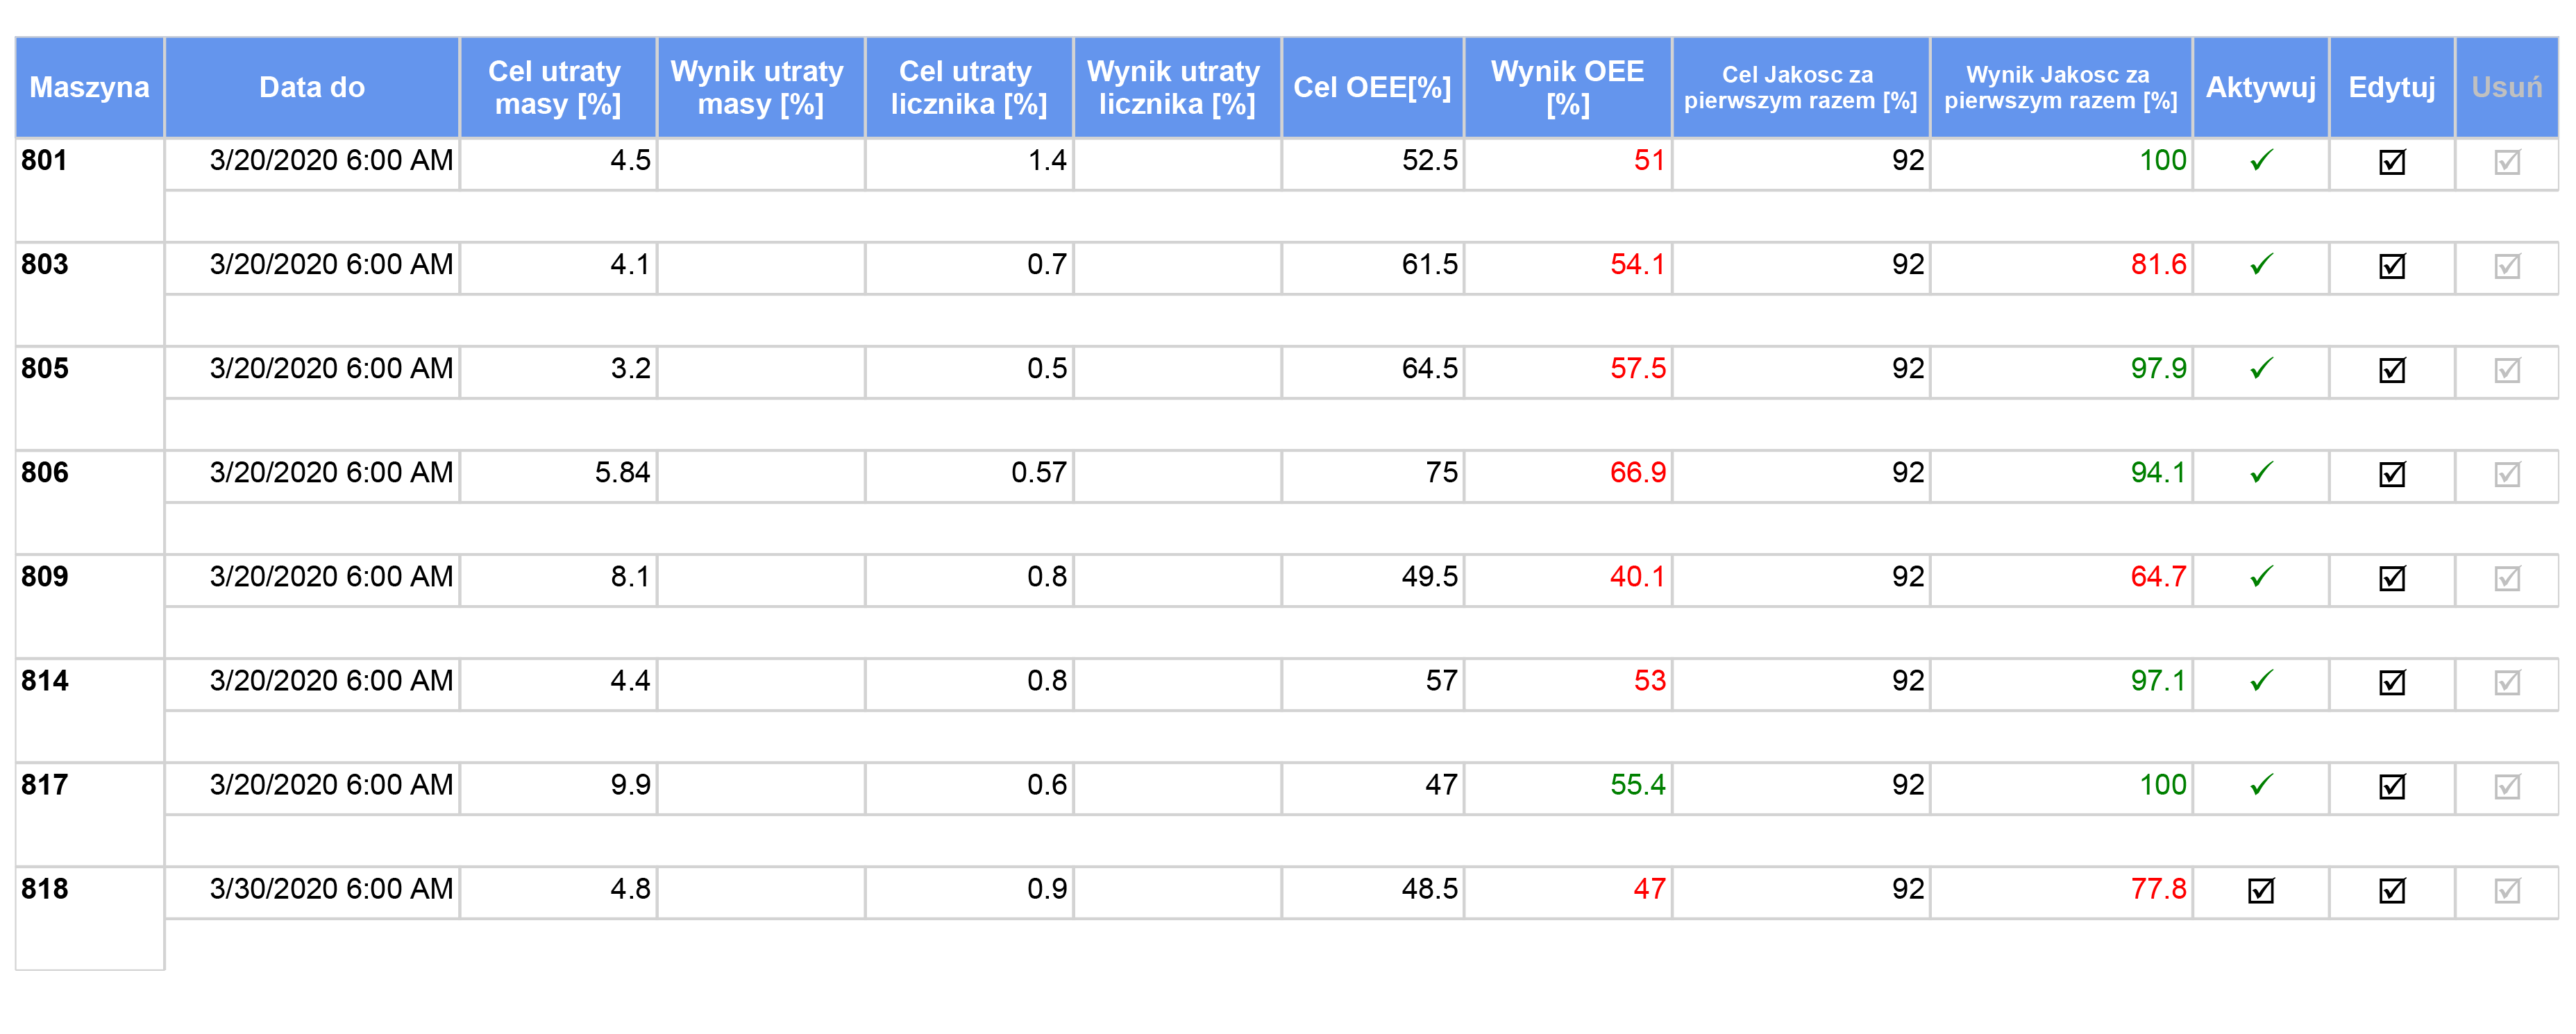
Analysis of loss and quality parameter report
The report shows product losses while transferring between facilities and product losses during packaging. The data is presented in a quantitative, and percentage manner and divided by weight and number of pieces. Qualitative parameters show what the goal of parameters/OEE for a given month was: presented by machine and actual result.
Necessary information before implementation
Indication of signal sources
The information from which system the data is to be downloaded (PLC driver, ERP system, database, etc.), along with a list of parameters to be archived and processed.